West Fork and East Park fires in southern Colorado

GOES-13 0.63 µm visible channel and 3.9 µm shortwave IR channel images (click image to play animation)

GOES-13 0.63 µm visible channel and 3.9 µm shortwave IR channel images (click image to play animation)

Two large fires burning in southern Colorado began to produce pyrocumulonimbus clouds and very large smoke plumes, as seen on GOES-13 0.63 µm visible channel (top panels) and 3.9 µm shortwave IR images (bottom panels)  on 19 June (above; click image to play animation) and on 20 June 2012 (below; click image to play animation). The larger fire on the left is the West Fork Complex, while the smaller fire on the right is the East Park fire.

GOES-13 0.63 µm visible channel and 3.9 µm shortwave IR channel images (click image to play animation)

GOES-13 0.63 µm visible channel and 3.9 µm shortwave IR channel images (click image to play animation)

A comparison of AWIPS images of POES AVHRR 0.86 µm visible channel, Cloud Top Temperature (CTT) product, and Cloud Top Height (CTH) product at 21:25 UTC (below) showed that CTT values just downstream of the fire source were as cold as -60 C (darker red color enhancement), where CTH values were as high as 12 km (darker green color enhancement).

POES AVHRR visible channel image, Cloud Top Temperature product, and Cloud Top Height product

POES AVHRR visible channel image, Cloud Top Temperature product, and Cloud Top Height product

Some photos of the pyrocumulonimbus clouds are shown below, from the Wildfire Today site.

Photo of West Fork Complex fire

Photo of West Fork Complex fire

Photo of West Fork Complex fire

Photo of West Fork Complex fire

 ===== 21 June Update =====

GOES-15 (left panels) and GOES-13 (right panels) visible and shortwave IR channel images (click image to play animation)

GOES-15 (left panels) and GOES-13 (right panels) visible and shortwave IR channel images (click image to play animation)

The West Fork fire complex continued to burn at an explosive rate on 21 June — a comparison of GOES-15 (left panels) and GOES-13 (right panels) 0.63 µm visible channel and 3.9 µm shortwave IR channel images ((above; click image to play animation) showed two very large smoke plumes with pyroCb clouds forming near the source of the fires.

A layer of high cirrus clouds began to move over the fire region later in the afternoon and early evening, masking the view of the pyroCb clouds and smoke plumes (01 UTC satellite images); however, the fire “hot spots” (red enhanced pixels) could still be sensed through the veil of high clouds. At around 01:04 UTC, a fantastic photo (photo 2 | photo 3 | photo 4) of the fire was taken by Luis Rosa (NWS San Juan Puerto Rico) from a passengert aircraft flying at 35,000 feet which showed the northernmost pyroCb cloud — likely the Papoose Fire — beneath the cirrus cloud layer (below).

Aerial view of pyrocumulonimbus cloud associated with the West Fork Fire Complex

Aerial view of pyrocumulonimbus cloud associated with the West Fork Fire Complex


Pyrocumulonimbus clouds in Alaska

GOES-15 0.63 µm visible channel images (click image to play animation)

GOES-15 0.63 µm visible channel images (click image to play animation)

As mentioned on the CIMSS Satellite Blog, record heat in Alaska led to an increase in wildfire activity in Alaska — and GOES-15 (GOES-West) 0.63 µm visible channel images (above; click image to play animation) showed the development of pyrocumulonimbus clouds associated with large fires burning in southwestern Alaska (to the northeast and northwest of Sparrevohn, PASV, left panels) and in southeastern Alaska (to the southeast of Northway PAOR, right panels) on 17 June 2013.

Silver Fire in southwestern New Mexico

GOES-13 0.63 µm visible channel images (click image to play animation)

GOES-13 0.63 µm visible channel images (click image to play animation)

The Silver Fire continued to burn in southwestern New Mexico on 13 June 2013. GOES-13 0.63 µm visible channel images (above; click image to play animation) showed the development of a well-defined pyrocumulonimbus cloud, which then began to merge with orographic cumulonimbus clouds which were building to the west of the fire.

POES AVHRR Cloud Top Height product

POES AVHRR Cloud Top Height product

An overpass of the POES (NOAA-19) satellite around 19:51 UTC showed that the AVHRR-derived Cloud Top Height of the pyrocb was in in the 11-12 km range, compared to maximum cloud top heights of 13-14 km with the orographic Cb clouds just to the west (above). The corresponding AVHRR Cloud Top Temperature (CTT) product (below) indicated that the CTT values of the pyroCb cloud were generally in the -45 C to -50 C range, compared to the minimum CTT value of -65 C associated with the more vigorous adjacent Cb clouds.

POES AVHRR Cloud Top Temperature product

POES AVHRR Cloud Top Temperature product


GOES-13 Imagery of Silver, New Mexico Fire

GOES-13 Visible and Shortwave IR Images (Click to Play Animation)

GOES-13 Visible and Shortwave IR Images (Click to Play Animation)

The Silver Fire continued to burn on June 12, 2013 in Southwestern New Mexico.  GOES-13  0.63 micrometer visible imagery (above, left panel; click image to play) showed an easily visible plume of smoke and pyrocumulonimbus cloud forming during the afternoon hours of the 12th.  Also, GOES-13 3.9 micrometer shortwave IR imagery (above, right panel; click image to play) showed a well defined hot spot before and after the formation of the pyrocumulonimbus.  Note the proliferation of red pixels during the afternoon hours in the IR imagery.  This is due to the ground temperatures reaching extreme levels parts of New Mexico and not due to fires.

Corresponding GOES-13 10.7 micrometer longwave IR imagery (below; click image to play) showed the development of a pyrocumulonimbus cloud during the late afternoon hours of June 12, 2013.  This animation showed cloud tops reaching -40 degrees Celsius before the convection collapsed.

GOES-13 IR Images (Click to Play Animation)

GOES-13 IR Images (Click to Play Animation)

Jaroso Fire in northeastern New Mexico

GOES-15 0.63 µm visible channel images (click image to play animation)

GOES-15 0.63 µm visible channel images (click image to play animation)

The Jaroso Fire in northeastern New Mexico produced a very large Pyrocumulonimbus cloud on 11 June 2013. GOES-15 0.63 µm visible channel images (above; click image to play animation; also available as a QuickTime movie) show the development of the well-defined pyroCb cloud, which then proceeded to drift rapidly eastward.

There were several other fires burning across parts of New Mexico and Colorado on 11 June — and early in the day on 12 June several large and very dense plumes of smoke aloft were apparent on GOES-15 0.63 µm visible channel images (below; click image to play animation), which stretched from Texas to Iowa.

GOES-15 0.63 µm visible channel images (click image to play animation)

GOES-15 0.63 µm visible channel images (click image to play animation)

Thompson Ridge Fire in New Mexico

GOES-15 (top) and GOES-14 (bottom) 0.63 µm visible channel images (click image to play animation)

GOES-15 (top) and GOES-14 (bottom) 0.63 µm visible channel images (click image to play animation)

The Thompson Ridge Fire (InciWeb) began burning on 31 May 2013 in northern New Mexico, just west of Los Alamos (station identifier KLAM). Five days later on 04 June, GOES-15 (GOES-West) and GOES-14 (GOES-East) 0.63 µm visible channel images (above; click image to play animation) showed the development of pyrocumulus near the source of the fire, as well as a long smoke plume that was being transported eastward. Late in the animation there was evidence of some small overshooting tops.

A ground-based photo of the pyrocumulus taken around 22:00 UTC is shown below.

Photo of Thompson Ridge Fire, looking north, around 22:00 UTC (courtesy of NWS Albuquerque)

Photo of Thompson Ridge Fire, looking north, around 22:00 UTC (courtesy of NWS Albuquerque)

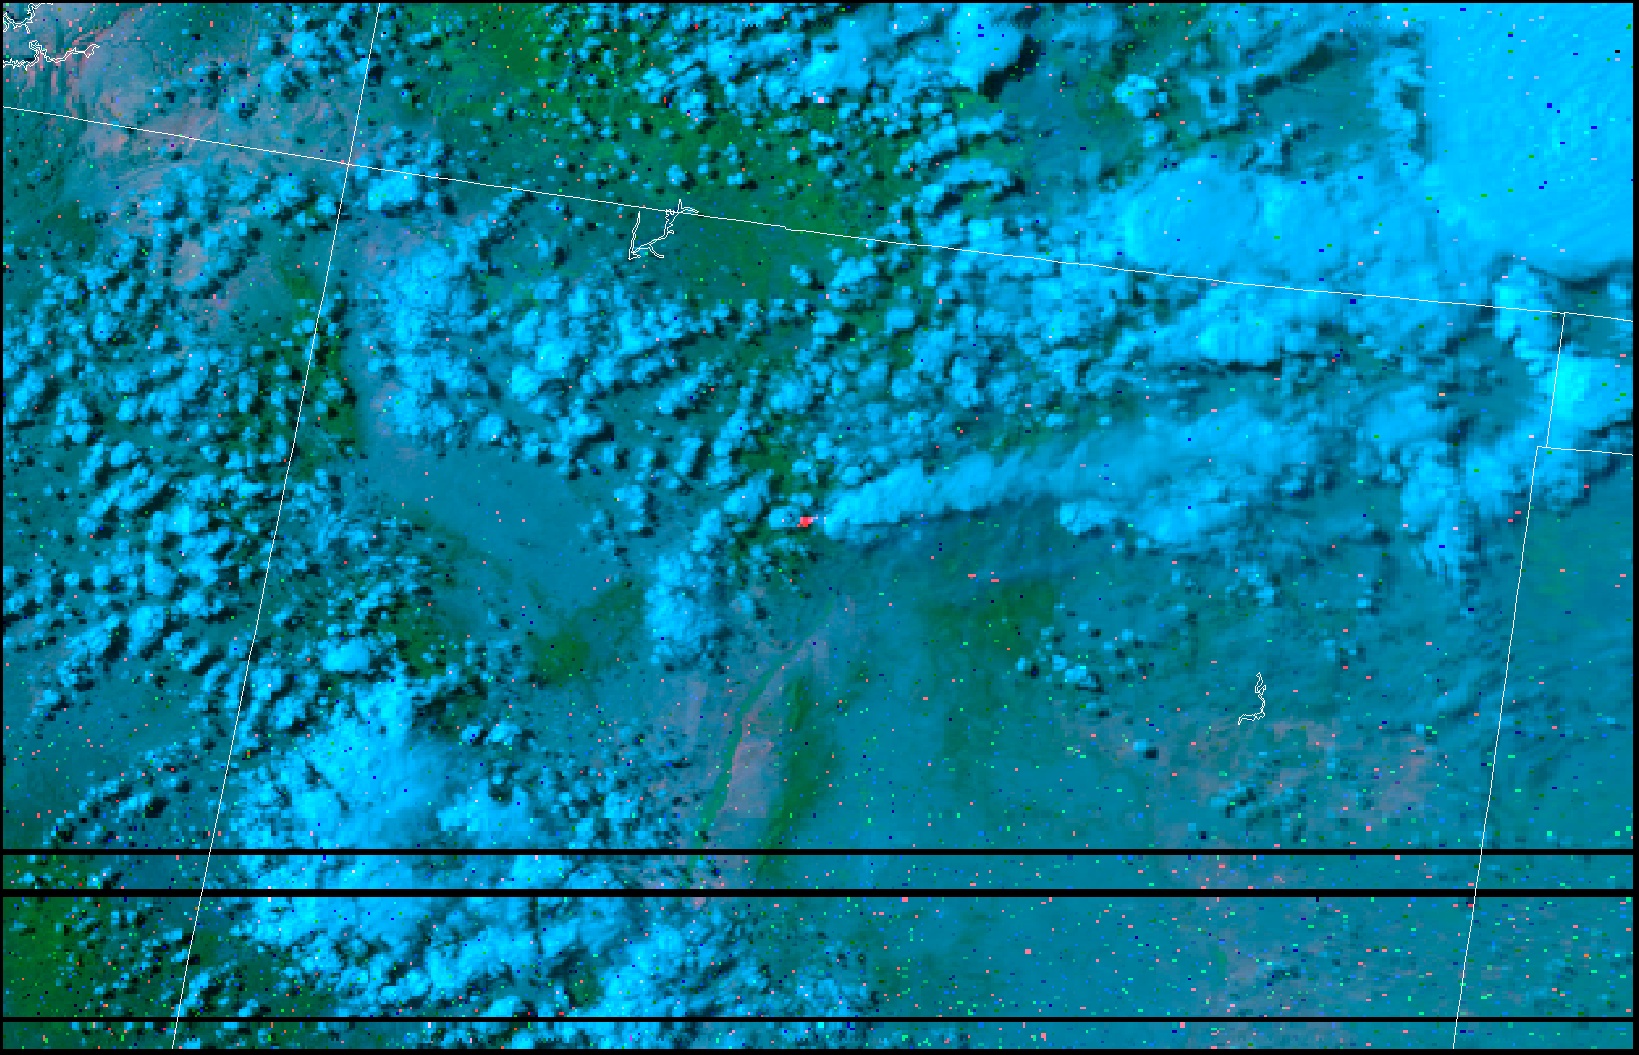
On a NOAA-15 false-color Red/Green/Blue image (using channels 3/2/1) at 23:55 UTC (below), the active fire shows up as the brighter pink feature.

NOAA-15 false-color image (using channels 3/2/1) at 23:55 UTC on 04 June (courtesy of René Servranckx)

NOAA-15 false-color image (using channels 3/2/1) at 23:55 UTC on 04 June (courtesy of René Servranckx)

On this same day, theere were also some pyrocumulus events associated with fires burning in Alberta, Saskatchewan, and Manitoba, as seen in animations of GOES-14 visible and IR imagery (courtesy of Dan Lindsey). 3-panel AVHRR images of those fires can be seen here (courtesy of René Servranckx).