PyroCb by Great Slave Lake in the Northwest Territories

GOES-15 0.63 µm visible (left) and 3.9 µm shortwave IR (right) images (click to play animation)

GOES-15 0.63 µm visible (left) and 3.9 µm shortwave IR (right) images (click to play animation)

On August 5, 2014 one of the fires surrounding the Great Slave Lake in the Northwest Territories, Canada produced a pyroCb detected by GOES-15 0.63 µm visible channel and 3.9 µm shortwave IR channel images (above; click image to play animation) around 20:00 UTC located near 60.5º North and 115º West, then rapidly drifting west as it develops.  At that time the fire source hot spot on the shortwave IR image (right panel) showed an IR brightness temperature of 338.3 K (red enhancement).

GOES-15 10.7 µm IR images (click to play animation)

GOES-15 10.7 µm IR images (click to play animation)

The corresponding GOES-15 10.7 µm IR channel images (above; click to play animation) indicated that the pyroCb cloud feature displayed a minimum IR brightness temperature value of -43.9º C at 20:00 UTC.  As the pyroCb developed, the cloud top continued to get colder and, therefore, higher up in the atmosphere.

The Aqua MODIS image (below) taken at 20:20 UTC shows the pyroCb in it’s very early stages of development.  The red pixels are hot spot enhancements, very similar to the enhancements on the shortwave IR imagery, indicating where the fires are located around Great Slave Lake.

MODIS true-color image of Great Slave Lake with a red-pixel enhancement over the fires.

Aqua MODIS true-color image of Great Slave Lake with a red-pixel enhancement over the fires.


PyroCb multi-day outbreak event along the California and Oregon border

On July 30, 2014, a lightning strike started the Oregon Gulch Fire, part of the Beaver Complex of fires, becoming an extremely active fire due to the very dry conditions in this part of the country.  As these fires grew, another thunderstorm system passed through northern California on August 1, 2014 with over 1,000 lightning strikes recorded; this system started a series of fires in that area that quickly spread with the help of the even drier conditions compared to southern Oregon.  These two areas of fires created several pyroCbs starting August 1 to August 3, 2014.

___________________________________________

GOES-15 0.63 µm visible (left) and 3.9 µm shortwave IR (right) images (click to play animation)

GOES-15 0.63 µm visible (left) and 3.9 µm shortwave IR (right) images (click to play animation)

On August 1st, 2014 at 02:45 UTC, the Beaver Complex Fire produced a pyroCb just north of the California/Oregon border near Ashland, Oregon. GOES-15 0.63 µm visible channel and 3.9 µm shortwave IR channel images (above; click image to play animation) showed that the pyroCb cloud feature became well-defined starting 02:00 UTC, drifting rapidly northward into a line of thunderstorms. At that time the fire source hot spot (located near 41º North, 122.2º West) exhibited an IR brightness temperature of 338.3 K (red enhancement).

The corresponding GOES-15 10.7 µm IR channel images (below; click to play animation) indicated that the pyroCb cloud feature displayed a minimum IR brightness temperature value of -43.9º C starting 01:00 UTC and quickly grew in height based on the colder temperatures indicated by the IR brightness temperature.

GOES-15 10.7 µm IR images (click to play animation)

GOES-15 10.7 µm IR images (click to play animation)

During the development of this pyroCb, the 173rd Fighter Wing of the Oregon Air National Guard flew F-15 Eagle fighter jets over the area and captured some incredible pictures of the pyroCb around 02:00 UTC or 8:00pm local time. The GOES-15 visible and shortwave IR image is a still frame taken about the same time as the photos were taken from the cockpit of the F-15 Eagle.

GOES-15 0.63 µm visible (left) and 3.9 µm shortwave IR (right) image at 02:00 UTC on August 1, 2014.

GOES-15 0.63 µm visible (left) and 3.9 µm shortwave IR (right) image at 02:00 UTC on August 1, 2014.


An F-15 Eagles from the 173rd Fighter Wing, Oregon Air National in the foreground of a pyroCb produced from the Oregon Gulch Fire. (Photo Credit: Jim “Hazy” Haseltine, HIGH-G Productions)

An F-15 Eagles from the 173rd Fighter Wing, Oregon Air National in the foreground of a pyroCb produced from the Beaver Complex Fire. (Photo Credit: Jim “Hazy” Haseltine, HIGH-G Productions)

An F-15 Eagles from the 173rd Fighter Wing, Oregon Air National in the foreground of a pyroCb produced from the Oregon Gulch Fire. (Photo Credit: Jim “Hazy” Haseltine, HIGH-G Productions)

An F-15 Eagles from the 173rd Fighter Wing, Oregon Air National in the foreground of a pyroCb produced from the Beaver Complex Fire. (Photo Credit: Jim “Hazy” Haseltine, HIGH-G Productions)


___________________________________________

On Friday August 1, two more pyroCbs manifested in the same region.  GOES-15 visible channel and IR channel images (below) show the first pyroCb developed around 23:00 UTC located near 41º North, 121.1º West and the second event around 01:00 UTC on August 2 located near 42º North, 122º West.

GOES-15 0.63 µm visible (left) and 3.9 µm shortwave IR (right) images (click to play animation)

GOES-15 0.63 µm visible (left) and 3.9 µm shortwave IR (right) images (click to play animation)


The GOES-15 10.7 µm IR channel images (below; click to play animation, also available as an MP4 move file) during the same time frame as the visible and shortwave IR show that these two pyroCb features display a  minimum IR brightness temperature value of -43.9º C at 23:30 UTC  located near 41º North, 121.1º West and 01:30 UTC located near 42º North, 122º West.

GOES-15 10.7 µm IR images (click to play animation)

GOES-15 10.7 µm IR images (click to play animation)

 ___________________________________________

The fires in Northern California and Southern Oregon on August 2, 2014. (Photo Credit: Wildfire Today)

The fires in Northern California and Southern Oregon on August 2, 2014. (Photo Credit: Wildfire Today)

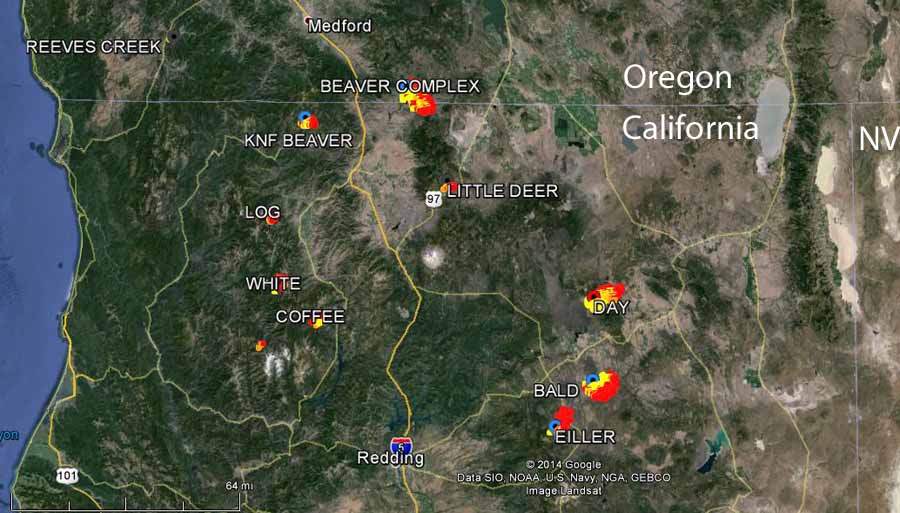
Saturday, August 2 was an extremely active day for fires burning in Southern Oregon and Northern California.  These fires produced an astounding five pyroCbs seen in the GOES-15 visible channel and shortwave IR channel images (below; click to play animation).  The first pyroCb manifested from the Beaver Complex Fire around 21:00 UTC located right on the California/Oregon Border (42º North, 122.3º West).  The Bald Fire in California spawned the second pyroCb around 22:00 UTC near 41.7º North and 122º West. The third pyroCb event was produced from the KNF Beaver Fire just south of the California/Oregon border (located near 42º North, 123º West) around 23:00 UTC.  The Eiller Fire, just southwest of the Bald Fire, developed the fourth pyroCb around 00:30 UTC on August 3 approximately located at 41º North and 121.5º West.  The final pyroCb was generated from the Little Deer fire (located near 41º North, 121.5º West) around 01:45 UTC August 3.
GOES-15 0.63 µm visible (left) and 3.9 µm shortwave IR (right) images (click to play animation)

GOES-15 0.63 µm visible (left) and 3.9 µm shortwave IR (right) images (click to play animation)


GOES-15 10.7 µm IR images (click to play animation)

GOES-15 10.7 µm IR images (click to play animation)

The corresponding GOES-15 10.7 µm IR channel images (above; click to play animation) show the pyroCb cloud features for all five events starting around 21:00 UTC.  All these events happened quite rapidly and the GOES-15 10.7 µm IR channel images do an excellent job showing on pyroCb spawning after another after another.

Here is a night-time comparison of AWIPS images of Suomi NPP VIIRS 3.74 µm shortwave IR and 0.7 µm Day/Night Band data (below) at  10:21 UTC (or 3:21 AM local time) on August 3.  The shortwave IR image “hot spots” (black to yellow to red enhancement) shows these fires continuing to burn through the night.

Suomi NPP VIIRS 3.74 µm shortwave IR and 0.7 µm Day/Night Band images

Suomi NPP VIIRS 3.74 µm shortwave IR and 0.7 µm Day/Night Band images


PyroCb event in British Columbia

GOES-15 0.63 µm visible (left) and 3.9 µm shortwave IR (right) images

On August 2nd, 2014 a pyroCb was detected in British Columbia by GOES-15 0.63 µm visible channel and 3.9 µm shortwave IR channel images (above). The pyroCb occurred around 02:45 UTC, located near 53º North and 125º West. The shortwave IR images (right panel) shows several hot spots (black to red pixels), but only the southern most hot spot forms into a pyroCb. The red pixel enhancement shows when the fires reach an IR brightness temperature of 338.3 K.  The pyroCb moves north after formation and starts to dissipate. This is seen most easily in the GOES-15 10.7 µm IR channel images (below).  

GOES-15 10.7 µm IR images

The upper air sounding at Port Hardy (below) shows that the winds present in the upper troposphere were indeed moving northward at 15-20 knots.

Port Hardy, BC sounding at 00 UTC on 02 August

The Terra MODIS image (below) was taken at 10:00 UTC and shows the aftermath of the pyroCb event. The red pixel enhancements, like the shortwave IR images, show the location of fires.

Terra MODIS true-color image of the British Columbia fires with a red-pixel enhancement over the fires.

PyroCb in the Northwest Territories of Canada

GOES-15 0.63 µm visible (left) and 3.9 µm shortwave IR (right) images (click to play animation)

GOES-15 0.63 µm visible (left) and 3.9 µm shortwave IR (right) images (click to play animation)

On the evening of 29 July 2014, a small pyroCb cloud was produced by a one of the ongoing fires in the Northwest Territories of Canada. GOES-15 0.63 µm visible channel and 3.9 µm shortwave IR channel images (above; click image to play animation; also available as an MP4 movie file) showed that the pyroCb cloud feature became well-defined on the 00:30 UTC (30 July) image, drifting rapidly northeastward. At that time the fire source hot spot (located near 61.5º North, 121.7º West) exhibited an IR brightness temperature of 338.3 K (red enhancement).

The corresponding GOES-15 10.7 µm IR channel images (below; click to play animation; also available as an MP4 movie file) indicated that the pyroCb cloud feature displayed a minimum IR brightness temperature value of -43.9º C at 03:30 UTC.

GOES-15 10.7 µm IR images (click to play animation)

GOES-15 10.7 µm IR images (click to play animation)

The -43.9º C GOES-15 IR brightness temperature corresponded to an altitude of 23,662 feet (7215 meters) on the Fort Smith, Northwest Territories rawinsonde profile at 00 UTC on 30 July (below).

Fort Smith, Northwest Territories rawinsonde data (00 UTC 30 July)

Fort Smith, Northwest Territories rawinsonde data (00 UTC 30 July)

NOAA ARL HYSPLIT forward trajectories initiated at the location of the coldest GOES-15 cloud-top IR brightness temperature (at altitudes of 6, 7, and 8 km) suggested that the high-altitude smoke would be transported eastward, then northeastward during the subsequent 36 hours (below).

HYSPLIT model forward trajectories at altitudes of 6, 7, and 8 km

HYSPLIT model forward trajectories at altitudes of 6, 7, and 8 km

A composite of Suomi NPP VIIRS true-color swaths during the daytime on 30 July (below) did show an area of dense smoke over much of western Nunavut, which was in agreement  with the transport shown by the HYSPLIT trajectories. The VIIRS image also showed large amounts of smoke being drawn southward along the back side of the deep 500 hPa low centered over James Bay.

Suomi NPP VIIRS true-color composite image for 30 July

Suomi NPP VIIRS true-color composite image for 30 July

Multiple PyroCb’s in northwestern Canada

åAfter several days of wildfire activity over parts of northern British Columbia (BC), northern Alberta (AB), and the Northwest Territories (NWT) of Canada (which produced a great deal of smoke, but no pyroCb activity), the conditions of the synoptic-scale environment became more favorable on 14 July 2014, allowing multiple pyroCb events (at least five?) to occur across that particular area. Very warm air was brought far northward — surface air temperatures as warm as 93º F or 33.9º C were seen in the Great Slave Lake region — ahead of a cold frontal boundary that was moving slowly eastward and southeastward across the region (surface analysis maps).

GOES-15 0.63 µm visible channel (left) and 3.9 µm shortwave IR channel (right) images (click to play animation)

GOES-15 0.63 µm visible channel (left) and 3.9 µm shortwave IR channel (right) images (click to play animation)

A comparison of GOES-15 (GOES-West) 1-km resolution 0.63 µm visible channel and 4-km resolution 3.9 µm shortwave IR channel images (above; click image to play animation) showed the widespread fire hot spots (dark black to red shortwave IR pixels) and the pyroCb clouds that developed in association with some of the larger fires.

The corresponding GOES-15 4-km resolution 10.7 µm IR channel images (below; click image to play animation; also available as a MP4 movie file) revealed that there were a few pyroCb clouds associated with the larger fires over northern BC, northern AB, and the NWT which began to exhibit cloud-top IR brightness temperature values of -40º C and colder (bright green color enhancement), indicating complete glaciation of the convective cloud top.

GOES-15 10.7 µm IR channel images (click to play animation)

GOES-15 10.7 µm IR channel images (click to play animation)

A higher spatial resolution view was provided by Suomi NPP VIIRS 375-meter (projected onto  a 1-km AWIPS grid) 0.64 µm visible channel, 3.74 µm shortwave IR, and 11.45 µm IR channel images at 21:10 UTC (below). The 4-letter identifier for regional upper air reporting sites are labeled in cyan.

Suomi NPP VIIRS 0.64 µm visible channel, 3.74 µm shortwave IR channel, and 11.45 µm IR channel images

Suomi NPP VIIRS 0.64 µm visible channel, 3.74 µm shortwave IR channel, and 11.45 µm IR channel images

On the corresponding VIIRS Red/Green/Blue (RGB) true-color image from the SSEC RealEarth web map server (below), the dense wildfire smoke was easy to identify due its gray appearance (in contrast to the brighter white clouds).

Suomi NPP VIIRS true-color Red/Green/Blue image

Suomi NPP VIIRS true-color Red/Green/Blue image

For 3 of the larger of the BC, AB, and NWT fires, NOAA ARL HYSPLIT model 180-hour forward air parcel trajectories (below) suggested a variety of long-range smoke transport pathways. The altitudes selected for the trajectories (8, 9, and 10 km) bracketed the approximate altitude of the -40º C level on the Fort Smith NWT (CYSM) and Fort Nelson, BC (CYYE) 12 UTC rawinsonde data.

HYSPLIT forward trajectories from BC pyroCb

HYSPLIT forward trajectories from BC pyroCb

HYSPLIT forward trajectories from AB pyroCb

HYSPLIT forward trajectories from AB pyroCb

HYSPLIT forward trajectories originating from NWT pyroCb

On the following morning of 15 July, Suomi NPP VIIRS visible and IR images (below) showed a large remnant pyroCb cloud that had drifted to the east of Great Slave Lake. The coldest VIIRS IR brightness temperature was -56º C, which was close to the tropopause temperature on the 12 UTC  Fort Smith (CYSM) sounding.

Suomi NPP VIIRS 0.64 µm visible, 3.74 µm shortwave IR, and 11.45 µm IR channel images

Suomi NPP VIIRS 0.64 µm visible, 3.74 µm shortwave IR, and 11.45 µm IR channel images

PyroCb in northern Alberta, Canada

GOES-13 0.63 µm visible (left) and 3.9 µm shortwave IR (right) images (click to play animation)

GOES-13 0.63 µm visible (left) and 3.9 µm shortwave IR (right) images (click to play animation)

Kudos to Mark Ruminski (NOAA/NESDIS Satellite Analysis Branch) for spotting this pyroCB event in far northern Alberta, Canada late in the day on 14 June 2014. McIDAS images of GOES-13 1-km resolution 0.63 µm visible channel (left panels) and GOES-13 4-km resolution 3.9 µm shortwave IR channel (right panels) data (above; click image to play animation; also available as an MP4 movie file) showed the initial subtle signal of a fire “hot spot” at 19:30 UTC (exhibiting an IR brightness temperature 293.1 K), whose temperature increased rapidly to 320.6 K at 19:37 UTC. By 21:55 UTC, the maximum IR brightness temperature of the fire hot spot was 337.7 K.

A 4-panel comparison of GOES-15 (GOES-West) and GOES-13 (GOES-East) visible and shortwave IR images (below; click image to play animation; also available as an MP4 movie file) indicated that with the more favorable western view angle from GOES-15, the fire hot spot was able to be detected at an earlier time (18:30 UTC), and also at a number of later times when the hot spot was obscured from the view of GOES-13 by dense pyroCb clouds.

GOES-15 (left panels) and GOES-13 (right panels) visible and shortwave IR channel images (click to play animation)

GOES-15 (left panels) and GOES-13 (right panels) visible and shortwave IR channel images (click to play animation)

An AWIPS image comparison of 1-km resolution Suomi NPP VIIRS 0.64 µm visible channel and 11.45 µm IR channel data at 20:51 UTC (below) showed the initial plume of pyroCb clouds drifting northeastward from the fire source (which actually showed up as a hot, dark black cluster of pixels, even on the longwave IR image). The coldest IR brightness temperature of the pyroCb cloud at that time was -53º C.

Suomi NPP VIIRS 0.64 µm visible channel and 11.45 µm IR channel images

Suomi NPP VIIRS 0.64 µm visible channel and 11.45 µm IR channel images

A 1-km resolution NOAA-18 AVHRR 10.8 µm IR channel image at 23:11 UTC (below) also showed a minimum IR brightness temperature of -53º C for the pyroCb cloud.

NOAA-18 AVHRR 10.8 µm IR channel image

NOAA-18 AVHRR 10.8 µm IR channel image

The initial northwestward drift of the pyroCb cloud followed by a southwestward drift of the pyroCb cloud is explained by the change in wind direction with height, as seen on a nearby rawinsonde profile from Fort Smith, Northwest Territories (below). According to this sounding, the tropopause was at a height of 10.6 km, where the air temperature was -60º C.

Fort Smith, Northwest Territories rawinsonde profile

Fort Smith, Northwest Territories rawinsonde profile

The fire complex continued to burn into the night; a VIIRS 3.74 µm shortwave IR image at 10:36 UTC on 15 June (below) showed the cluster of fire hot spots (black pixels).

Suomi NPP VIIRS 3.74 µm shortwave IR image

Suomi NPP VIIRS 3.74 µm shortwave IR image

The Suomi NPP OMPS Aerosol Index (below; courtesy of Colin Seftor) showed the signature of fire smoke on 15 June, with a maximum AI value of 5.2.

Suomi NPP OMPS Aerosol Index product

Suomi NPP OMPS Aerosol Index product